UK CPI Inflation Review: Headline and Core Fall More Broadly, But Momentum Still Evident

UK headline and core inflation have been on a clear downward trajectory in the last few months the former having peaked above 10% in February and the latter at 7.1% In May. However, this trend surprisingly stalled in December as the headline rate rose a notch to 4.0%, up from a 27-month low of 3.9%, the first rise in 10 months and where the core rate remained at 5.1%, still a 23-month low. They both stayed there in January too. However, the downtrend seemingly resumed in the February CPI numbers and clearly so (Figure 1), despite higher petrol prices, with food acting as a major offset. Indeed, undershooting consensus and BoE thinking the headline rate fell to 3.4%, a 29-month low and the core down to 4.5% a 23-month low, including a belated slowing in y/y services prices to a cycle low of 6.1%. But there was some rise in apparent core momentum as measured by adjusted m/m numbers (Figure 2), including still-solid service strength, albeit this more likely to be noise than a definitive change in trend and where services inflation historically is stronger than core goods.
Figure 1: Headline and Core Inflation Drop Resume

Source: ONS, Continuum Economics
The softer February CPI data came alongside mixed PPI data at least for manufacturing. Regardless, CPI headline inflation slowed to 3.4% y/y in February 2024, down from 4.0% in January. The largest downward contributions to the monthly change in CPI annual rates came from food, and restaurants and cafes, while the largest upward contributions came from housing and household services, and motor fuels. – NB; restaurant inflation is often seen as a good guide to persistent price pressures and thus its fall is reassuring. Core CPI (excluding energy, food, alcohol and tobacco) rose by 4.5% in the 12 months to February 2024, down from 5.1% in January; the CPI goods annual rate slowed from 1.8% to 1.1%, while the CPI services annual rate eased from 6.5% to 6.1%The headline rate is some 0.1 ppt below formal BoE thinking and is clearly a reassurance not least as all but three of the 12 main components saw a further drop and where our estimate of the seasonally adjusted data continued the clear disinflation trend seen in months prior to December, albeit perhaps less discernibly. Indeed, on this basis, CPI core inflation was just above target and slightly more so as it was on a 3 mth/3 mth annualized basis, a measure that the B0E is starting to use more formally – indeed, there was some rise in core momentum as measured by the adjusted m/m numbers in the February data however (Figure 2), including still solid services pressures!
Figure 2: Adjusted Core CPI Pressures Have Been Falling Broadly Even on BoE Measure?
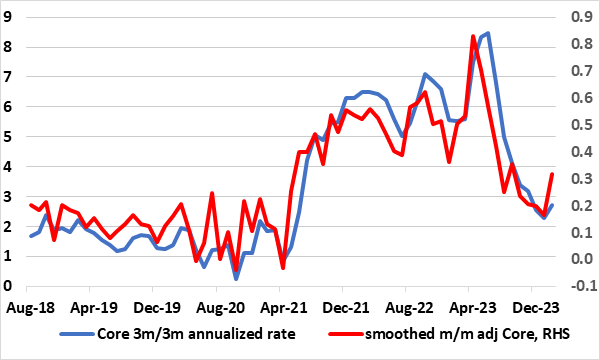
Source: ONS, Continuum Economics, smoothed is 3 mth mov avg
The CPI data have been perturbing for the BoE hawks and hence the MPC demand to see more data to assess how sizeable and durable the current disinflation process actually is. In this regard, the data were given to the BoE in advance of this release for the MPC to ponder over ahead of its decision tomorrow. The data is unlikely to make the BoE undergo a major change in thinking, but more likely there may be no further dissent in favor of more hikes and even some clearer discussion that interest rates can and perhaps should soon be less restrictive. MPC members such as arch-hawk Catherine Mann have highlighted the manner in which core goods inflation (Non-energy industrial goods, or NEIG) have fallen but services have been more resilience, something still evident in these CPI figures. Looking ahead, it is notable that favourable base effects and the drop in the energy cap should bring headline inflation down to even a touch below the 2% target by April, (after a circ-35% March reading, an outlook that the even the BoE acknowledges, albeit with the latter thinking this drop will be more on a short-lived basis than we think likely! But we still see a clear case for rate cutting to begin, most probably in June.