Eurozone GDP Preview (Jan 30): GDP - Actual Recession Continues?

According to official national accounts data, the EZ economy has been in near recession, having seen GDP move sideways in the year to Q3, albeit with a decline of 0.1% q/q in that latter quarter. We see another such drop occurring in the looming Q4 flash figure (Figure 1). Such a result, involving two consecutive quarters of GDP declines, would constitute a formal recession and would undershoot the small (ie 0.1%) growth that the ECB penciled in for last quarter. Such an undershoot would surely only accentuate very evident worries aired in the minutes to the last Council meeting that the ECB’s downgraded growth forecast were still too optimistic. Notably, such weakness is still being flagged by survey data such as the PMIs albeit slightly (Figure 2) less acutely at least for manufacturing. But it is of clear importance that they are suggesting that contracting activity may even be extending into the current quarter, especially if the weak construction sector readings are taken into account. Thus, we are envisaging not just a further and below-consensus fall of 0.2% in the looming flash Q4 GDP data (Figure 1) but with a further slide this quarter now a clear risk amid an outlook for the year of just 0.3% being less than half ECB thinking and with mounting downside risks attached.
Figure 1: Q4 EZ GDP Picture
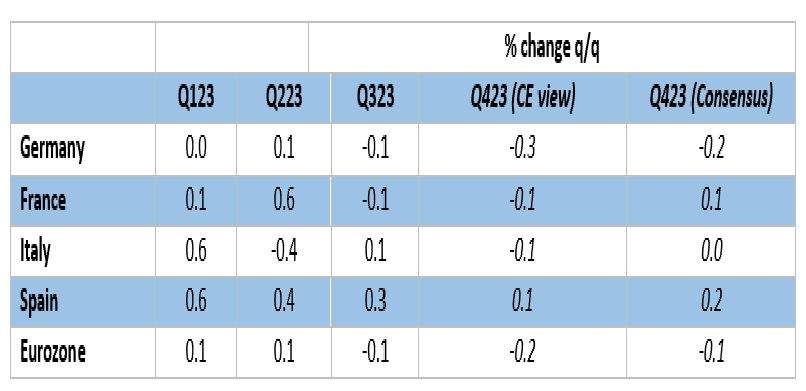
Source: Eurostat, Continuum Economics, Bloomberg
Policy Tightening Biting Further
This is very much below-consensus thinking too and encompasses the growing impact of ECB tightening, something evident not just in the rise in effective interest rates but the rise credit standards that banks are putting in place. As for details, this involves continued weakness in domestic demand, something that has been masked somewhat by relative resilience in headline GDP data where the y/y rate up to Q3 2023 was nothing worse than zero. This may remain the case in Q4, but largely due to continued marked declines in imports which have contributed exactly two whole ppt to growth in the year to Q3
There are few official monthly data that help make any credible estimate for EZ GDP computation. But in data for the first two months of Q4, retail sales are down moderately, as is construction, while industrial production is much weaker. Monthly visible trade data do suggest that GDP may get support from a further fall in real imports. But the main indicator that has been flashing red of late are the business survey data. Indeed, according to the PMIs, EZ business activity contracted continually through Q4.
Surveys Still Weak
As we have repeated before, we remain a little wary of the PMI data, at least in terms of offering insights in real activity, as the numbers cover only part of the EZ in either geographical or sector terms – the currently much softer construction PMI is not included in the composite measure. Notably, alternative and more broadly-based business survey data from the European Commission have painted a less upbeat picture. Regardless, now that all business surveys have taken a turn for the worse of late (Figure 2), belatedly suggesting that activity may now be contracting, led by a very marked slump in manufacturing. Partly as a result, expectations for growth in 2023 have started to sag but also taking on board a increasing acceptance of the sizeable direct and indirect impacts of ECB policy tightening. Also of note the EZ national account data has masked clear divergences among member economies with Germany faring poorly while Spain has seen clear growth. This is likely to have continued, albeit with even Spanish real activity momentum having faded in the last quarter
All of which points to GDP growth this year of 0.3% nothing better than last year, both very much at odds with(admittedly declining) consensus thinking of 0.5% for 2024 and even more so relative to ECB projections of 0.8%. But even elements within the ECB Council are accepting downside risks to this outlook based around the tightening of credit conditions. Indeed, in the December Council meeting account, it was argued that the transmission of monetary policy tightening, via prices (loan rates) and quantities (credit volumes) since the first rate hike in July 2022, was both much stronger and faster than expected, and much stronger and faster than suggested by macroeconomic models. It seems the transmission mechanism may now be biting even harder and this may be a key issue for the ECB meeting later this week.
Figure 2: Business Surveys Highlight Continued Downside EZ Growth Risks?
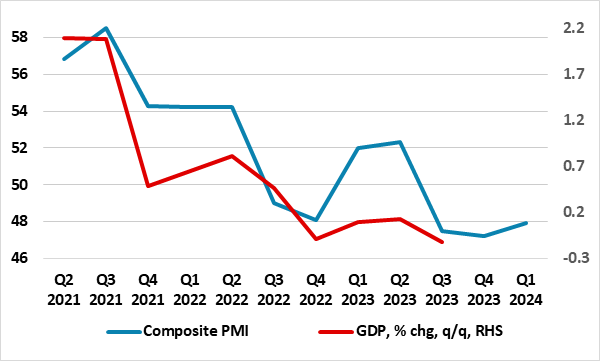
Source: Markit, European Commission
Flash GDP in Perspective
As we have underlined before, it is important to recognize that there are clear shortcomings to the flash estimate for GDP. No details comes with these flashes and they are prone to clear revisions. Indeed, the original Q4 and Q1 GDP numbers gave a clearly misleading impression, in that they implied initially modest growth in both quarters. Then Q2 GDP was initially recorded at 0.3%, only to be revised back as well, the same fate besetting the Q3 numbers too. Time will tell whether the Q4 flash numbers will tell any more authoritative a story!