Chart USD/ZAR Update: Sharp reversal lower - daily studies turning down

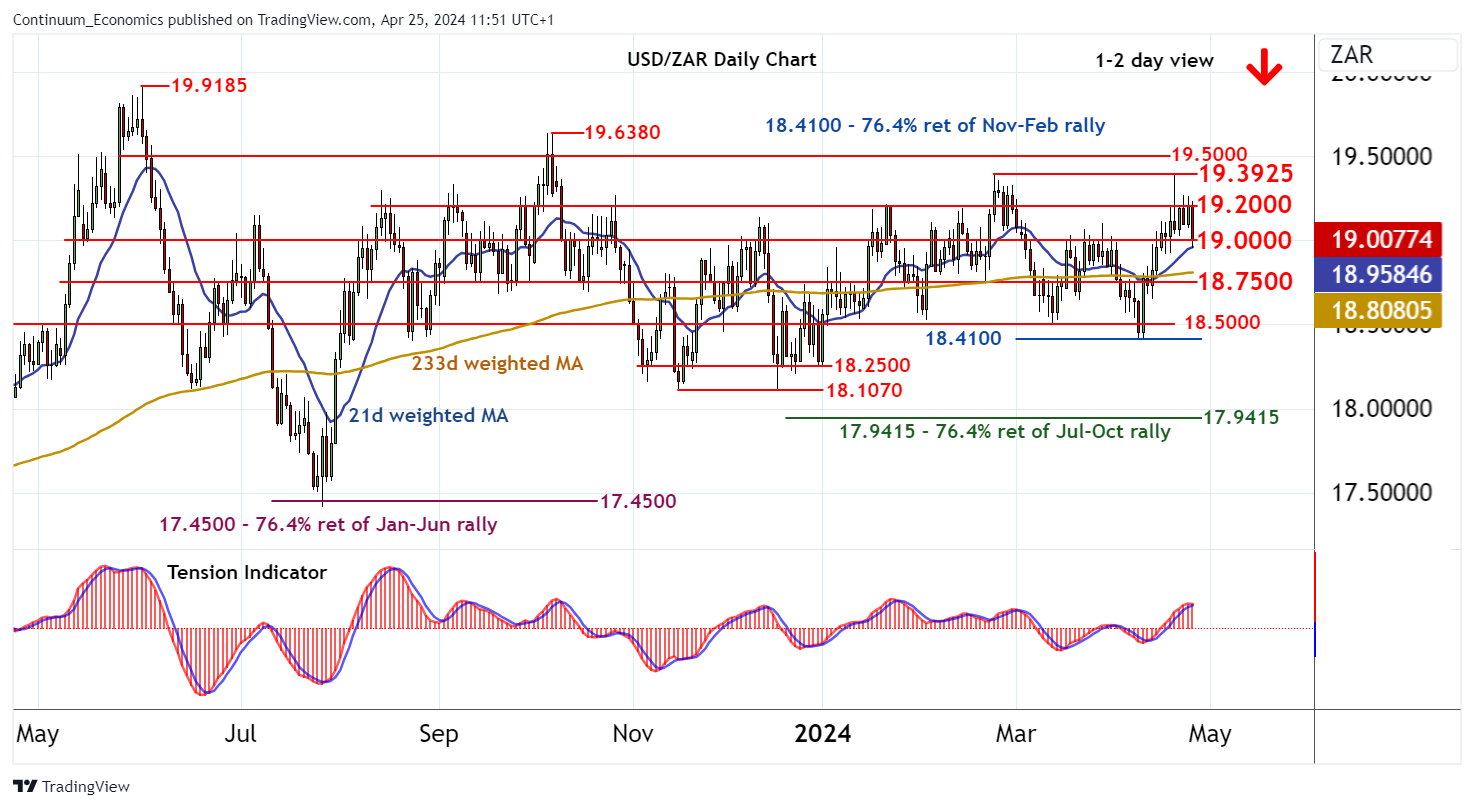
Cautious trade beneath resistance at 19.2000 has given way to a sharp pullback to congestion support at 19.0000
| Levels | Imp | Comment | Levels | Imp | Comment | |||
| R4 | 19.6380 | ** | 6 Oct (m) high | S1 | 19.0000 | * | congestion | |
| R3 | 19.5000 | ** | congestion | S2 | 18.7500 | * | congestion | |
| R2 | 19.3925 | ** | 23 Feb YTD high | S3 | 18.5000 | ** | congestion | |
| R1 | 19.2000 | break level | S4 | 18.4100 | ** | 76.4% ret of Nov-Feb rally | ||
Asterisk denotes strength of level
11:30 BST - Cautious trade beneath resistance at 19.2000 has given way to a sharp pullback to congestion support at 19.0000, as intraday studies turn down. Overbought daily stochastics are also unwinding and the daily Tension Indicator is turning negative, suggesting a deterioration in sentiment and room for deeper losses in the coming sessions. A close below 19.0000 will add fresh weight to sentiment and extend losses towards further congestion around 18.7500. However, rising weekly charts could limit any initial tests in fresh range trade. Meanwhile, an unexpected close above 19.2000 will turn price action cautiously positive and prompt a test of strong resistance at the 19.3925 current year high of 23 February. A further close above here would confirm extension of November gains towards congestion around 19.5000.