Chart GBP/USD Update: At fresh 2024 year lows - extending March losses

Cautious trade has given way to the anticipated break lower
| Level | Comment | Level | Comment | |||||
|---|---|---|---|---|---|---|---|---|
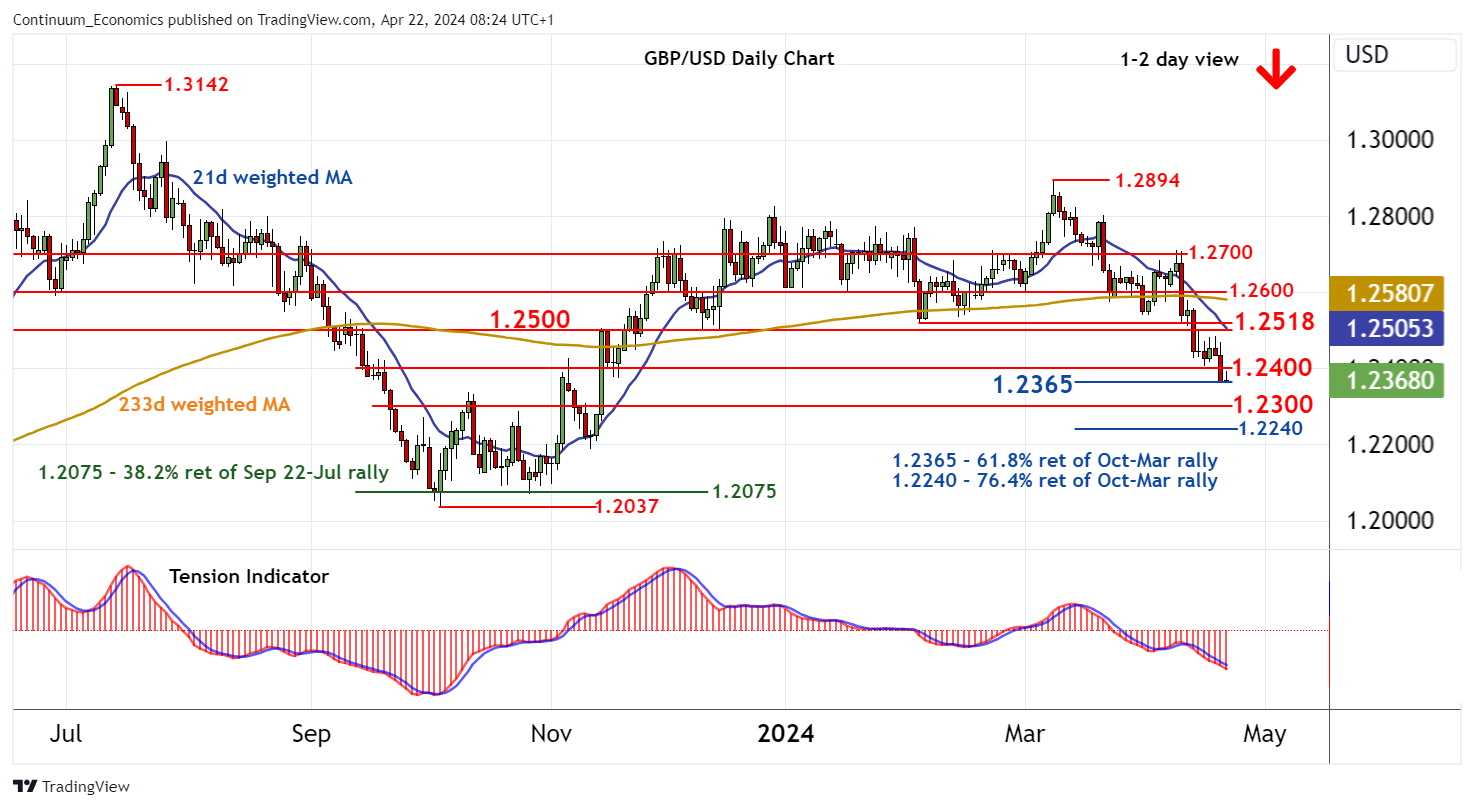
| R4 | 1.2650 | * | congestion | S1 | 1.2365 | ** | 61.8% ret of Oct-Mar rally | |
| R3 | 1.2600 | * | congestion | S2 | 1.2300 | * | congestion | |
| R2 | 1.2500/18 | ** | congestion; 5 Feb (m) low | S3 | 1.2240 | ** | 76.4% ret of Oct-Mar rally | |
| R1 | 1.2400 | * | congestion | S4 | 1.2200 | * | congestion |
Asterisk denotes strength of level
08:05 BST - Cautious trade has given way to the anticipated break lower, with prices currently pressuring support at the 1.2365 Fibonacci retracement. Intraday studies are negative and daily readings have also ticked down once again, highlighting a deterioration in sentiment and room for deeper losses in the coming sessions. A break below 1.2365 will add fresh weight to price action and extend March losses towards congestion around 1.2300. Broader weekly charts are currently also under pressure, pointing to potential for further slippage to the 1.2240 retracement. Meanwhile, resistance is lowered to congestion around 1.2400. A close above here, if seen, will turn sentiment and prompt consolidation beneath 1.2500/18.