Published: 2024-04-19T03:14:03.000Z
Chart USD/IDR Updates: Extending gains

Technical Analyst
1
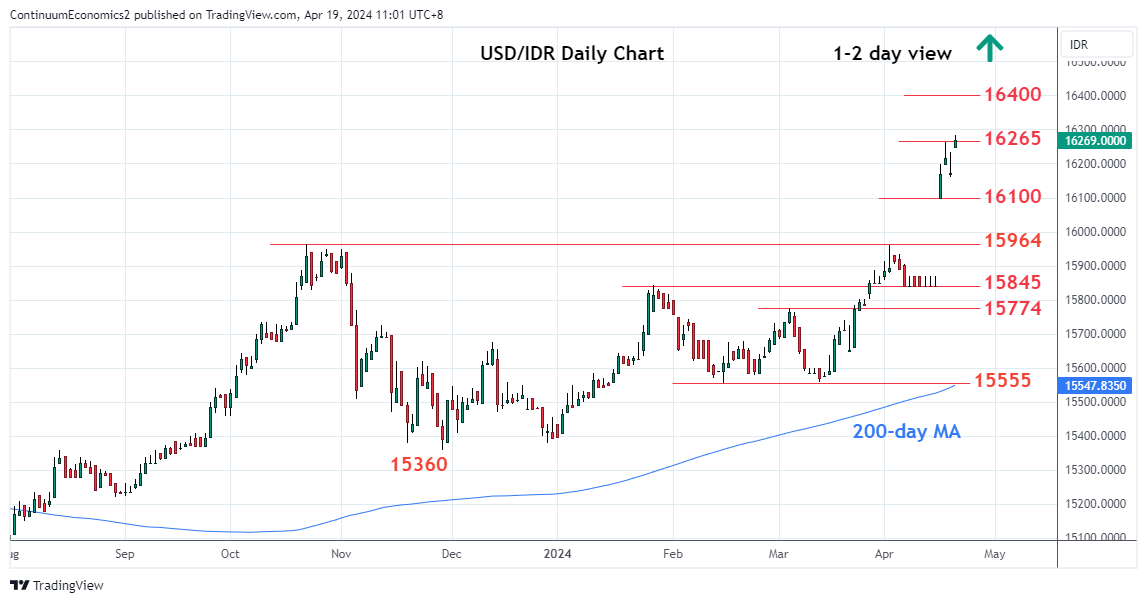
Rebound from 16159 low extending gains through the 16265 high to reach fresh YTD high
| Levels | Imp | Comment | Levels | Imp | Comment | |||
|---|---|---|---|---|---|---|---|---|
| R4 | 16625 | ** | 23 Mar 2020 year high | S1 | 16159 | * | 18 Apr low | |
| R3 | 16565 | * | 6 Apr 2020 high | S2 | 16100 | * | 16 Apr low | |
| R2 | 16400 | * | congestion | S3 | 16000 | * | figure | |
| R1 | 16285 | intraday high | S4 | 15964 | ** | 23 Oct 2023 year high |
Asterisk denotes strength of level
03:05 GMT - Limited on break of the 16200 support with rebound from 16159 low extending gains through the 16265 high to reach fresh YTD high. Above the 16285 intraday high will see scope to the 16400 congestion from April 2020. However, overbought daily studies caution corrective pullback with support now raised to the 16159 pullback low. Would take break here to open up deeper correction to the 16100 then the strong support at the 16000 level and 15964, the 2023 year high. Below these will fade the upside pressure and turn focus lower corrective gains from the May 2023 low.