Chart GBP/USD Update: Fresh year low - studies remain under pressure

The anticipated break below 1.2500/18 has extended
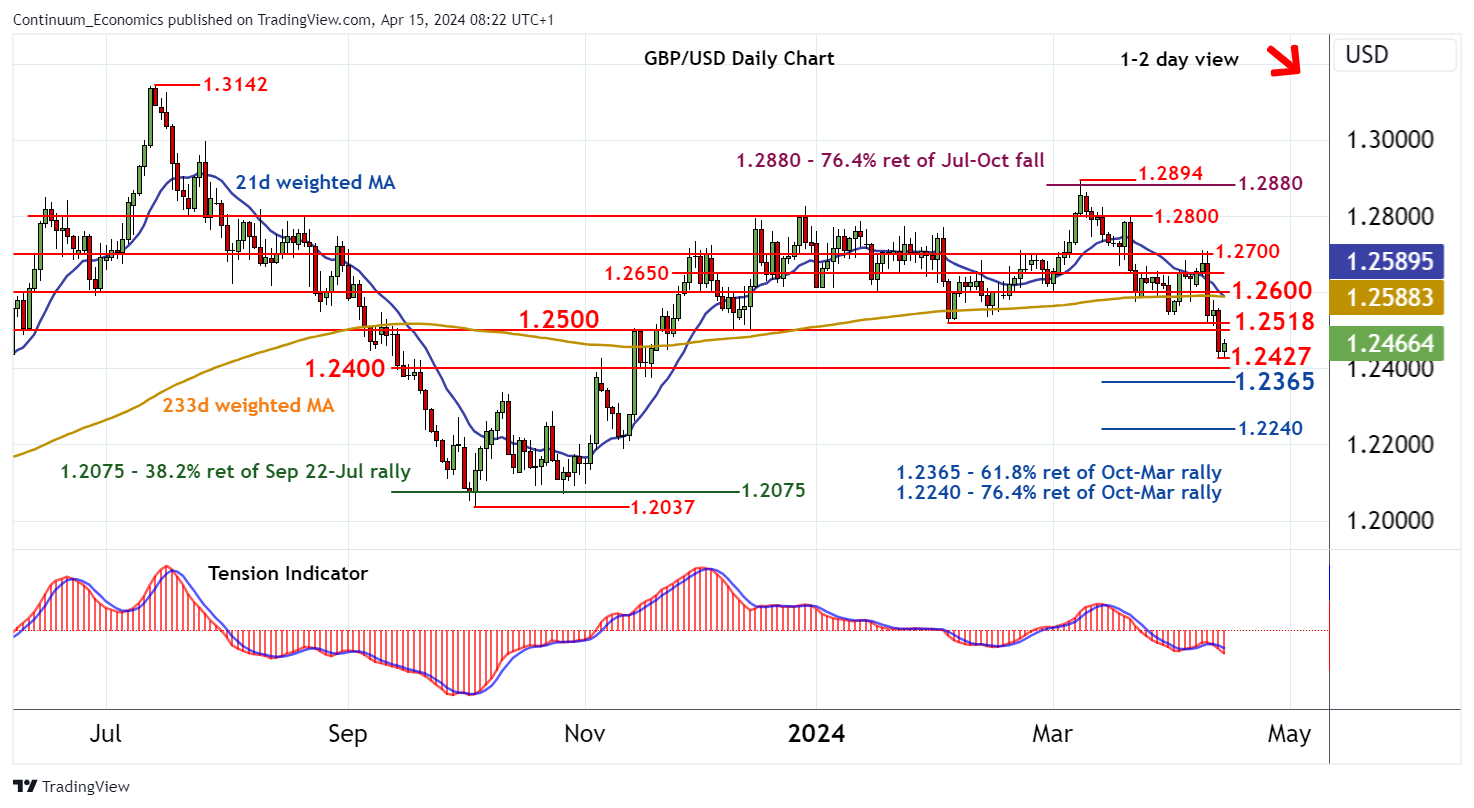
| Level | Comment | Level | Comment | |||||
|---|---|---|---|---|---|---|---|---|
| R4 | 1.2700/10 | * | break level; 9 Apr high | S1 | 1.2427 | ** | 12 Apr YTD low | |
| R3 | 1.2650 | * | congestion | S2 | 1.2400 | * | congestion | |
| R2 | 1.2600 | * | congestion | S3 | 1.2365 | ** | 61.8% ret of Oct-Mar rally | |
| R1 | 1.2500/18 | ** | congestion; 5 Feb (m) low | S4 | 1.2300 | * | congestion |
Asterisk denotes strength of level
08:05 BST - The anticipated break below 1.2500/18 has extended, with March losses posting a fresh 2024 year low of 1.2427 before stabilising. Oversold intraday studies are unwinding, suggesting potential for a minor bounce. However, daily readings continue to track lower and broader weekly charts are under pressure, suggesting difficulty sustaining any initial tests of 1.2500/18. In the coming sessions, cautious trade is expected to give way to fresh losses. A later break below 1.2427 will add fresh weight to sentiment and extend losses below congestion support at 1.2400 towards the 1.2365 Fibonacci retracement. Already oversold daily stochastics could prompt short-covering/consolidation around here.